
“Dashboards” tend to show measurement of key topics of interest. For the automobile driver, it includes speed, gasoline levels, rpm, engine heat, etc. For the climate, here are some dashboard elements…
- Ice (I’m melting!)
- Arctic
- Antarctic
- Water (Don’t waste me!)
- Aquifer levels – # of feet remaining for largest ones in U.S.?
- % of water use from desalinized efforts
- % of oceans that are polluted
- CO2 levels
- Many more measures possible, but we don’t want “data smog” either, where we can’t get a good sense because there are too many measures!
NICE “DASHBOARD COMPONENTS” IN VISUAL FORM
- Climate Dashboard (from http://interactive.guim.co.uk)
- Climate Spirals from Ed Hawkins
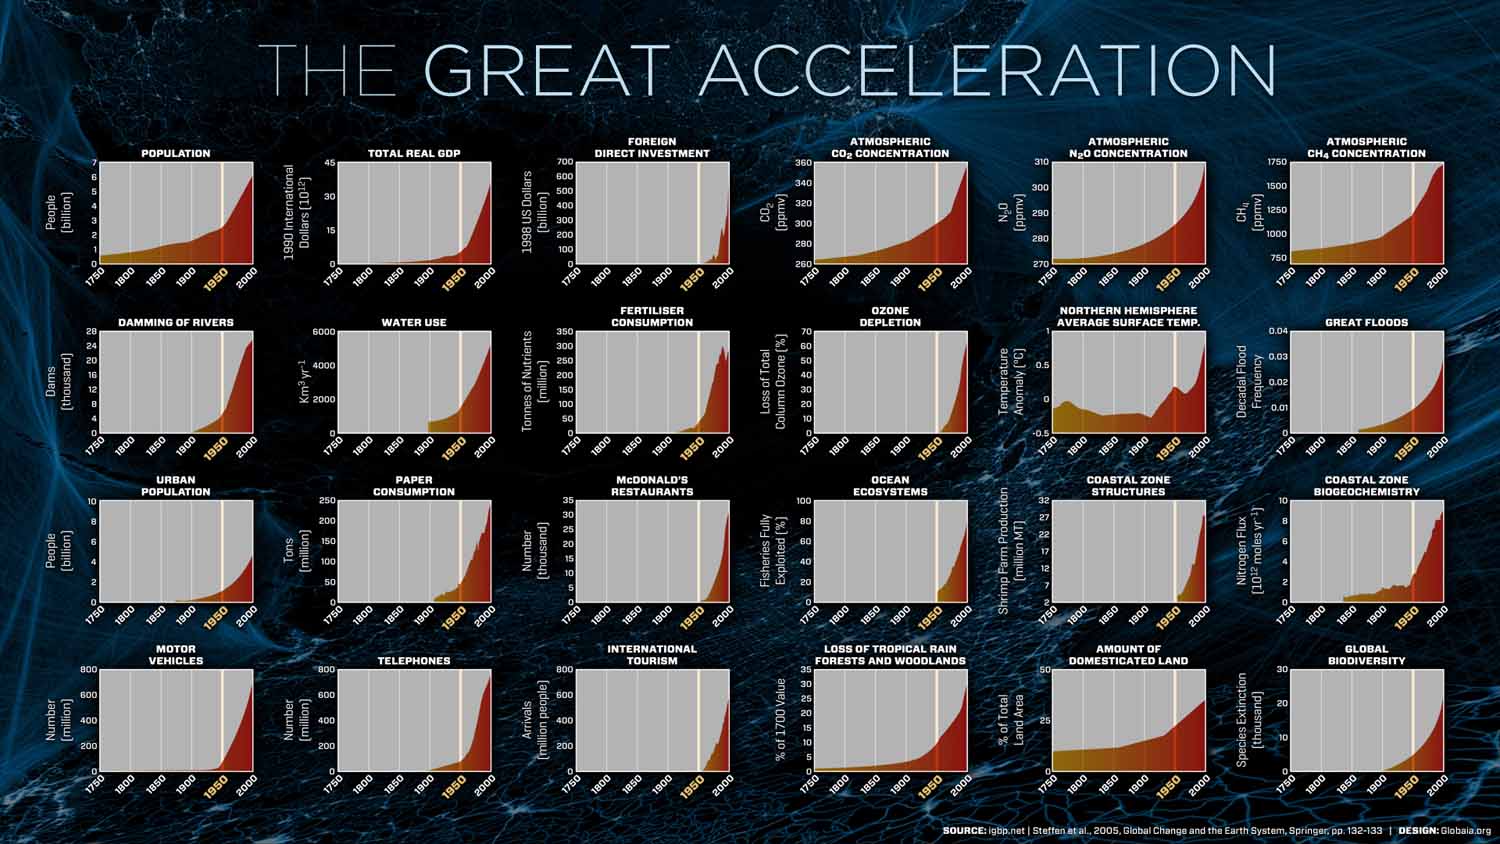
This from The Great Acceleration website
This effort using music and temperature data: A Song of Our Warming Planet
But, as George Marshall’s book title suggests (Don’t Even Think About It: Why Our Brains Are Wired to Ignore Climate Change) we may need a different approach for much of the population than just providing numbers and making a philosophical argument… What form will a powerful argument take?
- songs that are Lehrer-esque?
- materials that can be shared easily with school groups so the children can influence their parents? (think “Woodsy the Owl,” “Smokey the Bear,” plus simple actions to be taken by families – “don’t let it run – the water faucet that is!”; “catch it when it runs!” (when rinsing foods, warming water, etc., capture the excess in a container for other uses!); etc.
- cartoons that can spread information and “rejoice” opportunities?
Preliminary 10/2015 upshot: climate change is accelerating.